How to Turn the Content “Thermostat” Down
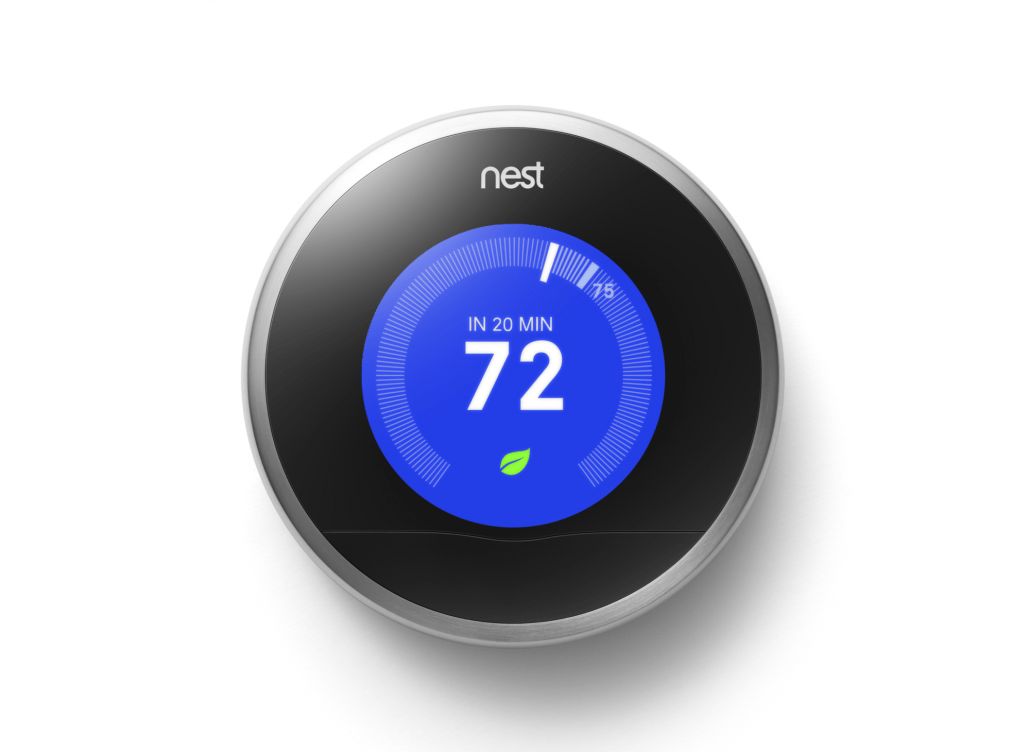
I finally justified to my wife why I bought $200 Nest thermostats a year ago…
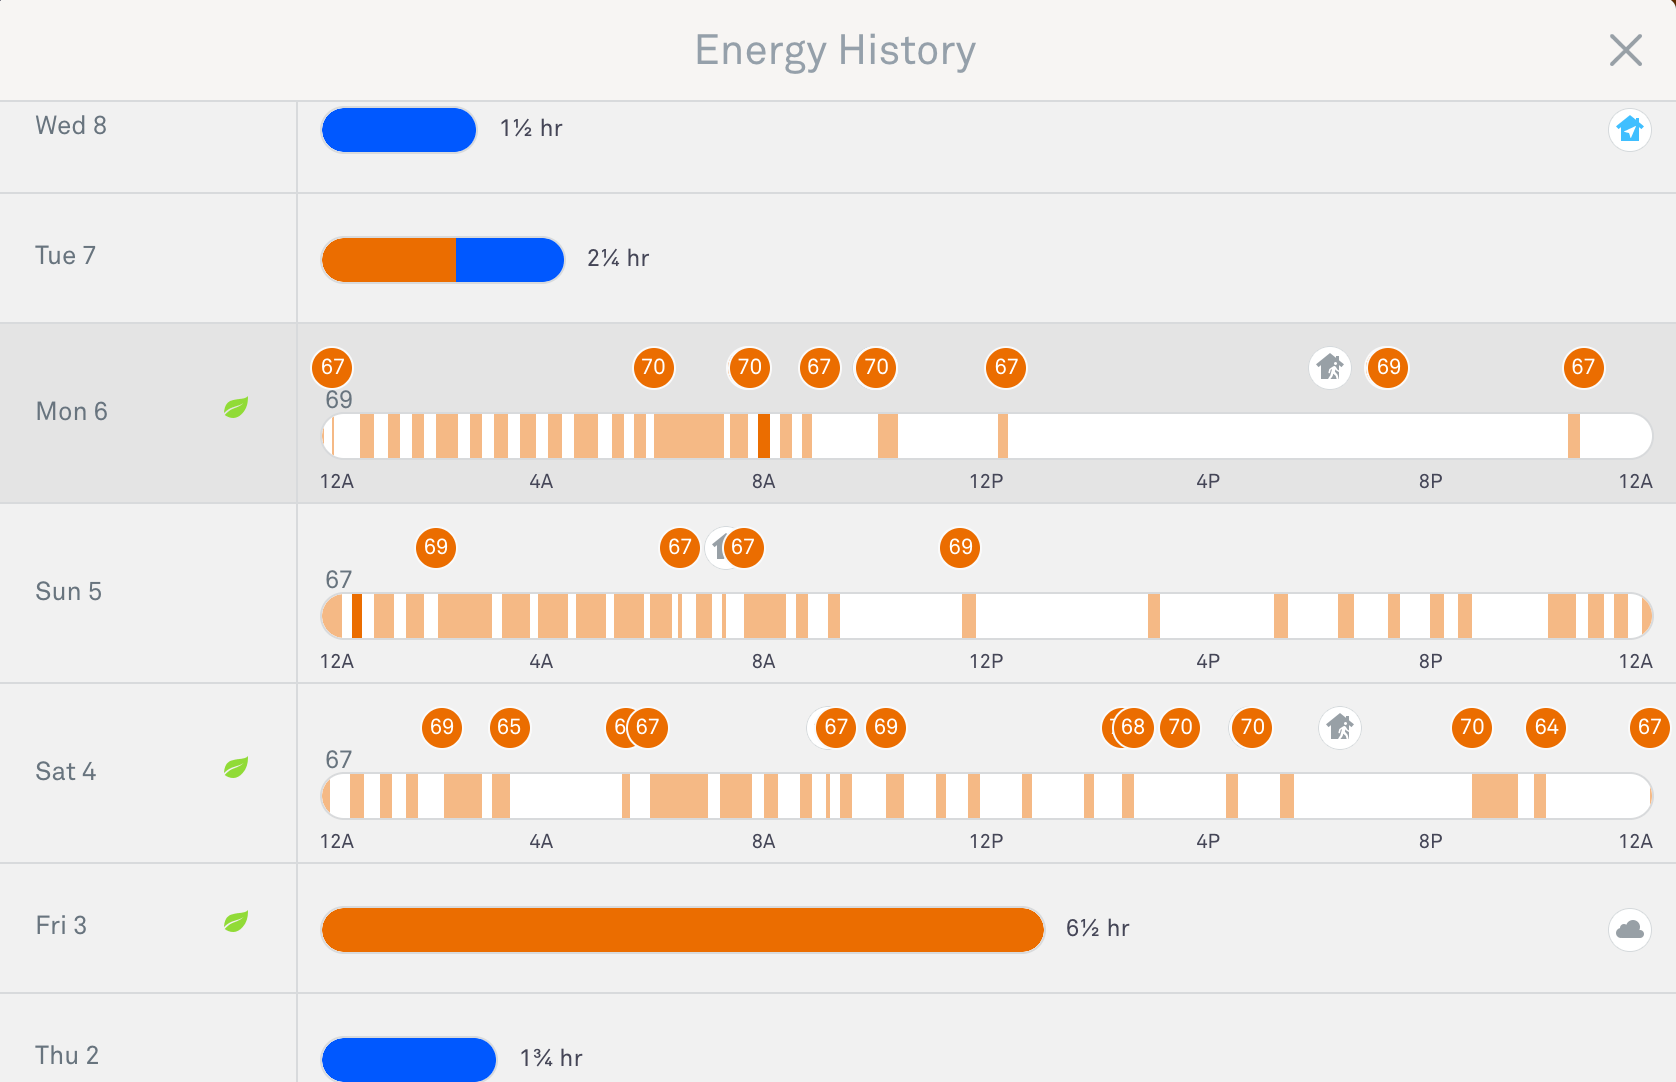
After receiving a heating bill that was double what we were expecting, I jumped into the metrics that Nest thermostats provide. Immediately I saw the problem… the heat was coming on repeatedly during the night (see Energy History below) during a time period we least needed it – A) our bedrooms are all upstairs where heat is trapped and B) we have heavy down comforters on our beds that essentially cook us in our sleep. (My wife would dispute that.) The translation? I was spending money on heat I didn’t need, and wasn’t even aware that this was a problem until I dug into the details.
The reality is that, in all likelihood, a similar situation is happening to you. Only, rather than heat, the money is being lost on pitfalls within your content creation and management process that are invisible to you.
According to a recent study run by Kapost and Gleanster, the average enterprise organization sees $0.25 of every dollar spent on content marketing efforts lost to various inefficiencies.
That’s actually A LOT of money when you break it down! Keep on reading…
Estimating Lost Content Spend
If we use the latest Gartner CMO Spend Survey, an enterprise company realizing $1B annually in revenues likely carries an overall marketing budget equalling about 12% of revenues. And if we lean back on the Kapost/Gleanseter survey mentioned earlier, an organization of this size is likely averaging about 55% of that marketing budget against content marketing efforts but seeing a waste of nearly $0.25 for every dollar spent. Let’s break that down…
- Company Size in Revenue: $1B
- Assumed Marketing Budget: $120M
- % Dedicated to Content Marketing: $66M
- Projected Waste: $16.5M
There’s your “heating bill” surprise… nearly $17M in marketing costs that would be considered wasted spend!
Obviously these figures are based on survey studies where you would have to plug in your own numbers, but the question remains, where are these dollars being lost? Is there a way that we can, in a sense, create a “Nest-like” analytics overview that helps us determine where our dollars are going out the door? I think the answer is “yes.”
At the risk of this blog article becoming a little numbers-heavy, allow us to make some further assumptions that can supported by the research studies already cited:
- Avg Number of Internal Resources: 15
- Avg Salary for Internal Content Resources: $60K
- Percentage of Time Against Content Creation: 62%
- Avg Hours/Month For External Resources: 130
- Avg Rate for External Resources: $130/hr
Using these numbers, it’s relatively easy to determine a blended FTE ($79/hr) which you can then project against the various types of content you might be creating using benchmarks of time/piece to create. Ultimately this yields what your investment is for each type of content which I would like to label PRODUCTION COSTS.
Then, assuming we can make educated guesses (or use available content analytics), we would be able to determine how much of the overall company revenue was influenced by content and segment that down to influence by content type. This would afford us a value per content type labeled as UTILIZATION VALUE.
Plotting these two values against one another would yield a nice quadrant matrix showing us which content was costing you the most to create, but not returning you any value in sales utilization. The output would look like the following:
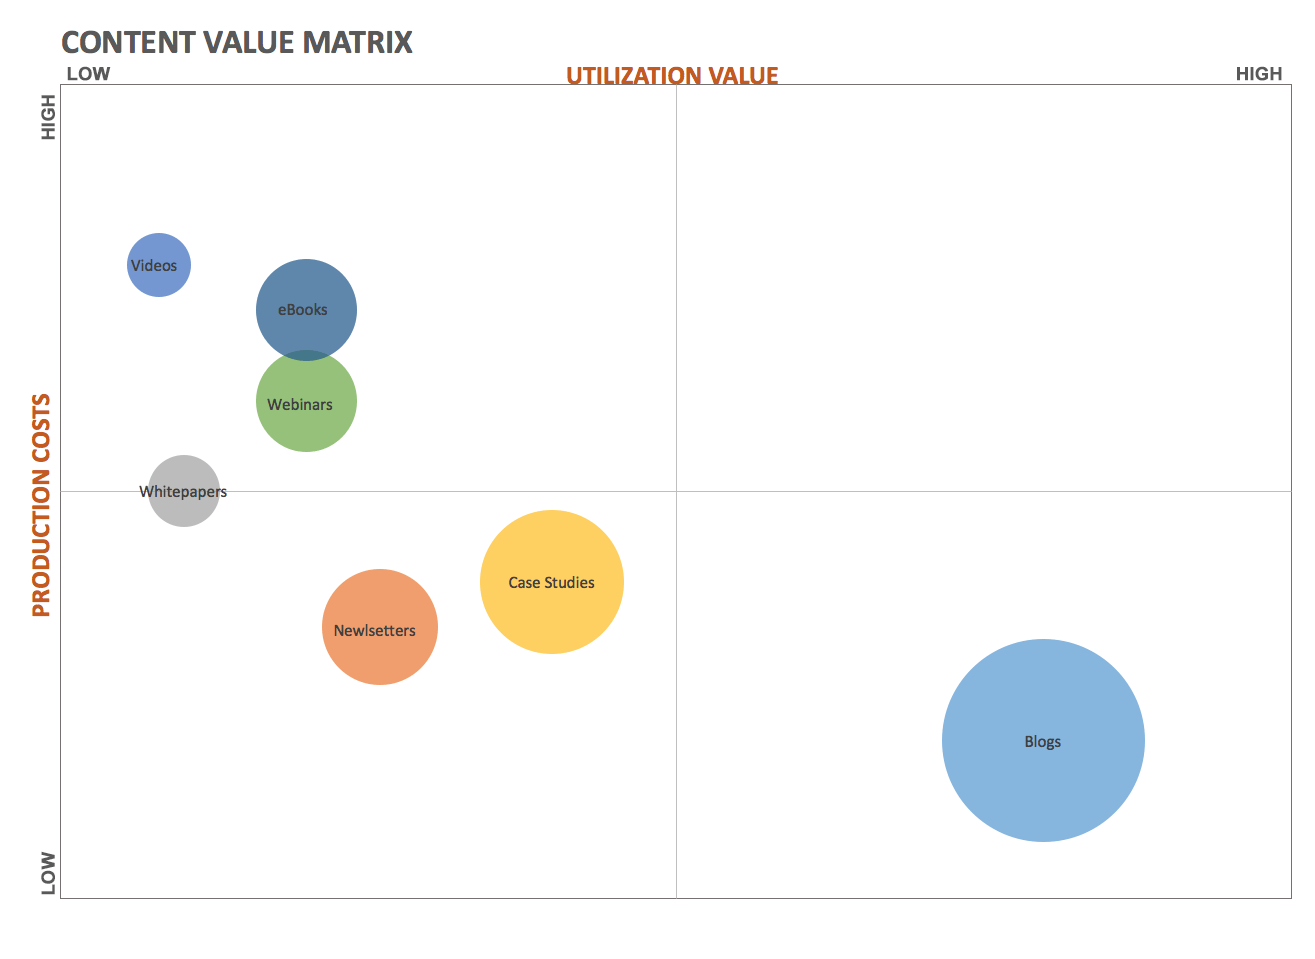
Based on this illustration, the upper left quadrant is the equivalent of my Nest analytics chart. These content types are where you are unnecessarily “heating the house.” Your videos, ebooks and webinars content would either need to be audited for value, or you would simply stop spending resource dollars on them.
Here’s the thing. Arriving at the values to give you this type of insight is not that difficult. Internal resource spend is merely an internal audit exercise. For content utilization, you would simply need the right analytics for determining content utilization by sales as they go after their sales quota.
We’d be happy to build the analytics that allow you these types of insights. After all, if lowering your heating bill is a priority for you at home, isn’t lowering your content bill an equally important goal in your marketing leadership role?